Eight Modules, Seventeen Stores, One Screen
A dealership group ran every department on its own spreadsheets and vendor portals, and closed the month by hand. We replaced the whole tangle with a single real-time operations platform.
Industry
Automotive Retail
Solution
Unified Operations Dashboard
Engagement
36 Weeks + Ongoing
Services
Enterprise Web Development
A Dealership Group That Could Not See Itself
The client runs a multi-brand dealership group of seventeen-plus stores, spanning executive, accounting, payroll, sales, fixed operations, vehicle inventory, financial reporting and internal support. Each had grown its own way of working: a vendor portal here, a shared workbook there, a monthly export stitched together by hand.
Individually, every department knew its own numbers. Collectively, nobody could answer a simple question — how is the group doing right now — without a week of reconciliation. Leadership was making decisions on figures that were already out of date by the time they arrived.
The Problems We Set Out to Solve
This was not a reporting problem dressed up as a software problem. The data existed — it was simply trapped in systems that had never been asked to speak to each other, with no access model, no live view, and a month-end process that ran on copy and paste.
Data scattered across disconnected departmental systems
Month-end reporting assembled by hand in Excel
No role-based access over financial and payroll data
No live, cross-store view for leadership
One Platform, Eight Modules Deep
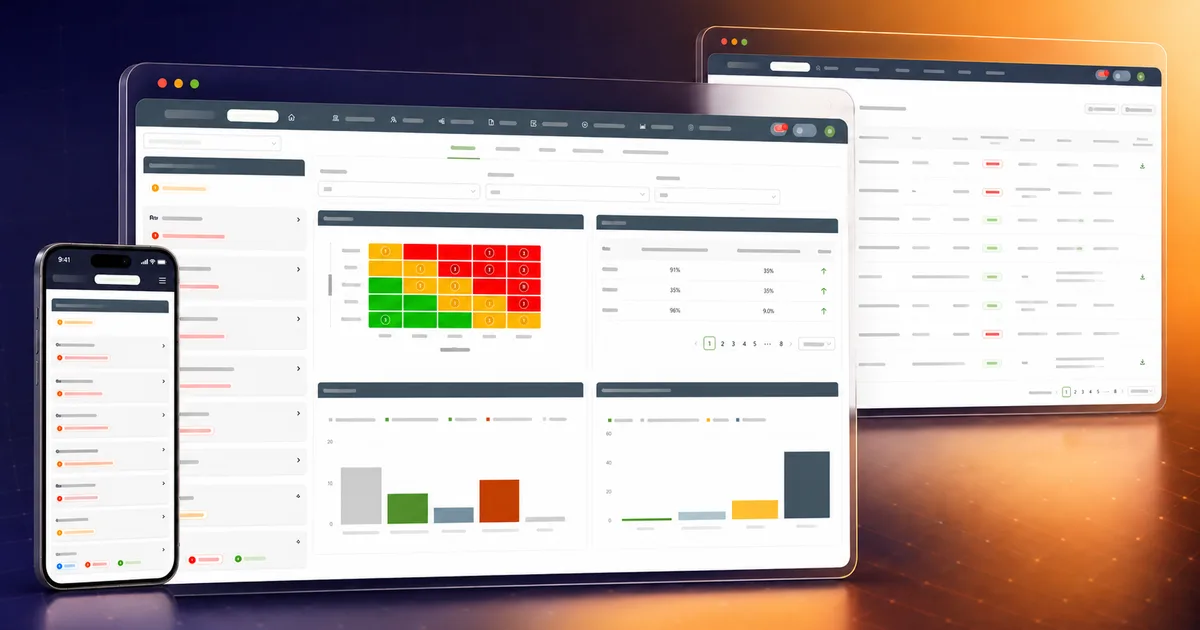
We built a single operations platform that every department signs into and sees only its own slice of — with the executive view sitting on top of all of them, live.
Unified Cross-Department Dashboard
Executive, accounting, payroll, sales, fixed operations and vehicle inventory data brought together behind one sign-on, with role-aware navigation.
Reporting in Seconds, Not Days
Automated real-time dashboards with one-click PDF and Excel export replaced the hand-assembled month-end workbook entirely.
Access Control That Actually Holds
Granular role-based access across departments and stores, backed by enterprise auth — Supabase, Clerk, Auth0 and AWS Cognito are all supported.
Live Visibility for Leadership
Live KPIs, interactive charts and drill-downs give executives an instant view across all seventeen stores instead of a stale monthly snapshot.
What the Platform Does
Executive
Executive summary with drill-down across every department, a GM approval tracker for deals and transactions, and net-profit analysis by store, department and period.
Accounting
Cash-in-transit reconciliation, dealer trades, F&I payables, manufacturer incentives tracked to VIN level, expense-trend and GL variance analysis, finance chargebacks, warranty revenue and bodyshop receivables.
Payroll
A self-service pay view for staff, real-time weekly commission calculation, monthly commission reporting, and a multi-level approval workflow for adjustments and bonuses.
Fixed Operations
Repair-order management, live parts inventory, VIN lookup, service-bay (stall) utilisation, and technician-productivity metrics.
Sales
A live sales board, F&I product penetration, lender (bank) performance and approval rates, a salesperson scorecard with leaderboards, and sales mapped by ZIP code.
Vehicle Inventory
Inventory across all stores with aging reports, turnover analysis, dollar-day supply showing carrying-cost impact, VIN search, and inventory flagged with open repair orders.
Financial Reports
Balance sheet, income statement with variance analysis, GL account analysis, and chart-of-accounts hierarchy management — generated live rather than assembled by hand.
Helpdesk
Internal ticketing with SLA tracking, canned responses, macros, satisfaction reporting, and an unresolved-ticket queue.
Users & Access
User and role management, per-role dashboard access, store-level permissions and multi-factor authentication.
Data Grids & Export
Sortable, filterable, Excel-like grids with copy-paste bulk entry, and CSV / Excel / PDF export on every major report.
Documents & Settings
Centralised document upload with version control, plus per-user settings, notifications and preferences.
Platform
Real-time notifications, responsive across desktop, tablet and mobile, and an internationalisation framework ready to extend beyond English.
Built for Live Data and Hard Access Boundaries
Frontend
Data & Auth
Visualisation
Reporting & Utils
Module by Module, Demoed Every Week
- 1
Discovery & Requirements — 4 weeks
Interviewed stakeholders across every department, mapped the existing workflows, and wrote down the spreadsheets nobody had written down.
- 2
MVP: Executive & Accounting — 8 weeks
Core authentication, the database schema, and the first two major modules — the ones leadership felt the pain of most.
- 3
Payroll & Sales — 6 weeks
Self-service pay and commission tracking, plus the sales dashboards, each through user-acceptance testing before release.
- 4
Fixed Ops & Vehicle Inventory — 8 weeks
The hardest stretch: VIN-lookup integration and repair-order tracking across the whole fleet.
- 5
Helpdesk & User Management — 4 weeks
Internal support ticketing, and the role-based access model administered from inside the product.
- 6
Financial Reports & Analytics — 6 weeks
Balance sheet, income statement and chart-of-accounts hierarchy, generated live rather than assembled.
- 7
Ongoing Enhancement
Two-week sprints with weekly demos to department heads, continuous deployment, and department champions testing in staging before every release.
What Changed
17+
Dealership Stores Unified
8
Modules on One Platform
60+
Dashboards & Reports
4
Auth Providers Supported
Month-end reporting went from a multi-day, copy-paste assembly job to an export that runs on live data.
Leadership sees profit, approvals and operations across every store as they happen, instead of reconstructing them a month later.
Financial and payroll data sits behind real, enforced role and store boundaries — not a UI that merely hides it.
Every department works in one platform, on one set of numbers, and the numbers agree.
Frequently Asked Questions
Yes — that is exactly what this project did. We brought executive, accounting, payroll, sales, fixed operations and vehicle inventory data together behind one sign-on, with role-aware navigation, across a group of seventeen-plus stores. The data usually already exists; it is simply trapped in systems that were never asked to speak to each other, and our job is to make them agree on one set of numbers.
Services Behind This Build
Explore Other Case Studies
Running a multi-site business on spreadsheets?
We build the platform that replaces them — one sign-on, real access control, and numbers that are true the moment you look at them.
Talk to a Delivery Expert